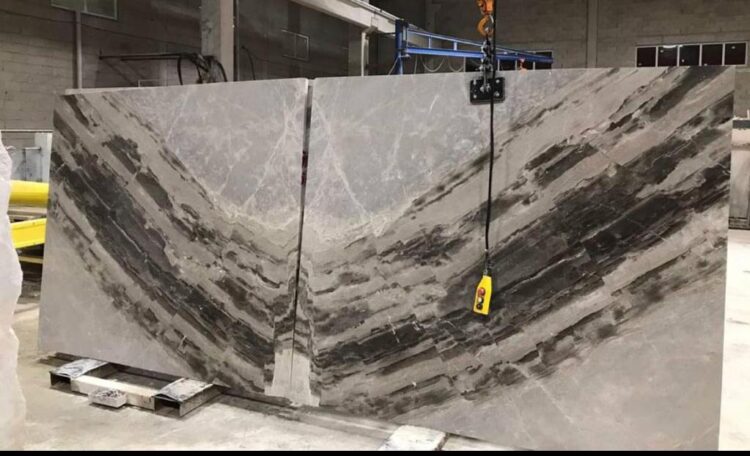
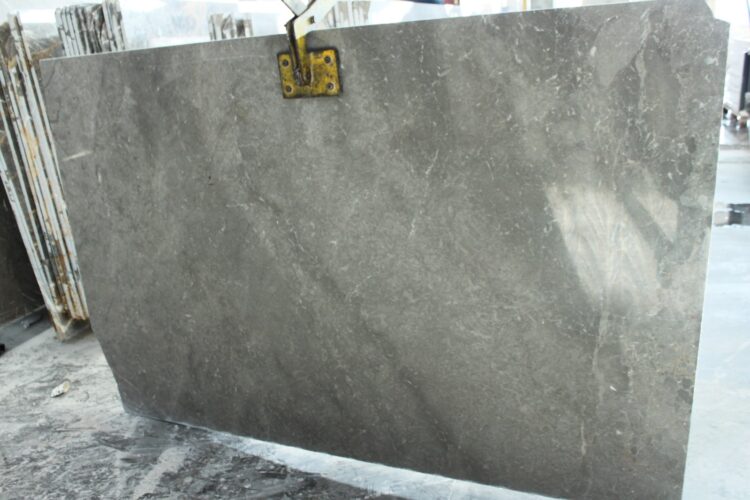
Exports of processed marble: 586,233,286 dollars
Export of processed travertine 204,062,729 dollars
Block exports 392,439,875 dollars
Turkey attracts attention worldwide with its rich natural stone reserves. Our geologically diverse country is known for its unique natural stone quarries in different regions. These precious stones are of great interest not only in local markets but also internationally. Thanks to their geological richness, these regions stand out as indispensable resources for industrial activities. In this context, the increase in Turkey’s natural stone exports marks an important development in both economic and geological terms. This report analyzes the increase in Turkey’s natural stone exports and the reasons for this increase, and presents the future prospects of the sector. When we examine the export data, we see that the Turkish natural stone sector exported 1,256,718,726 dollars between January-August 2024. The top 10 countries to which the sector realized the highest exports in the 8-month period were the United States, China, Saudi Arabia, India, Iraq, France, Australia, United Arab Emirates, Germany and Libya, respectively.
Market Assessment in Processed Marble
When we take a look at the processed marble export reports for the January-August 2023-2024 period, we see that there was a decrease of – 3.84 % in quantity and – 0.36 % in value. The sector earned 586,233,286 dollars from processed marble exports in the January-August period of 2024. The top 10 countries to which the most exports were realized are Iraq, Saudi Arabia, United Arab Emirates, Israel, Australia, Libya, Morocco, France and Kuwait, especially the United States of America.
Latest situation in block exports
Turning to the block market, we see a positive picture here as well. The sector experienced a slight increase in total quantity and value. The sector earned 392,439,875 dollars from block exports in the January-August period of 2024. This shows a growth in the sector in general. However, this growth has not been uniform for all countries; some countries have seen increases in the volume and value of imports, while others have seen significant declines. These changes indicate shifts in the dynamics of international trade, perhaps in local production capacities or consumption patterns. Such fluctuations in the sector should be taken into account for strategic planning and market positioning.
Let’s talk about processed travertine exports
The sector realized 460 million 774 thousand 796 exports in the 8-month period of 2024.
Some of the key findings of the report are as follows: In general, processed travertine exports around the world have decreased in terms of quantity, but have increased in terms of value in many countries. This may indicate that prices of processed travertine products are rising globally. These trends are closely related to market dynamics, consumer demand and changes in international trade policies.
What is the situation in country groups?
When we analyze the country group export tables and in the Near and Middle East Asian countries,
While there was a decline in Other Europe, West Africa, Other Asia; it can be seen from the statistics that there was an increase in Europe, North America and Central/South America, North Africa, Central/Eastern/Southern Africa, member countries of the European Union.
As for the figures:
– 359,798,388 USD valued exports were realized to other Asian countries. The decrease in value was –8,06%.
– Exports to North American countries amounted to 285,300,428 dollars. The increase in value was 9,46%.
– Exports to Near and Middle East Asian countries amounted to 245,243,927 dollars. Decline in value – 12,36%.
– Exports to European Union member countries amounted to 179,400,011 dollars. The increase in value was 14,93%.
– Exports to other European countries amounted to 59,012,876 dollars. The decrease in value was –-2,66%.
– Exports to North African countries amounted to 60,308,156 dollars. The decrease in value was 8 %.
– Exports to Central and South American countries amounted to 21,343,839 dollars. The increase in value was 1,92%.
– Exports to West African countries amounted to 3,811,306 dollars. The decrease in value was –25,74%.
– Exports to Central, Eastern and Southern African countries amounted to 4,094,693
dollars. The increase in value was 27,20%.


 +90 532 585 51 95
 +90 532 585 51 95